
GBP/USD Pullback Tests Key 1.3446-1.3465 Breakout Zone
Sterling retreats to a critical support band after surging past major technical levels Wednesday, putting bulls on defense.
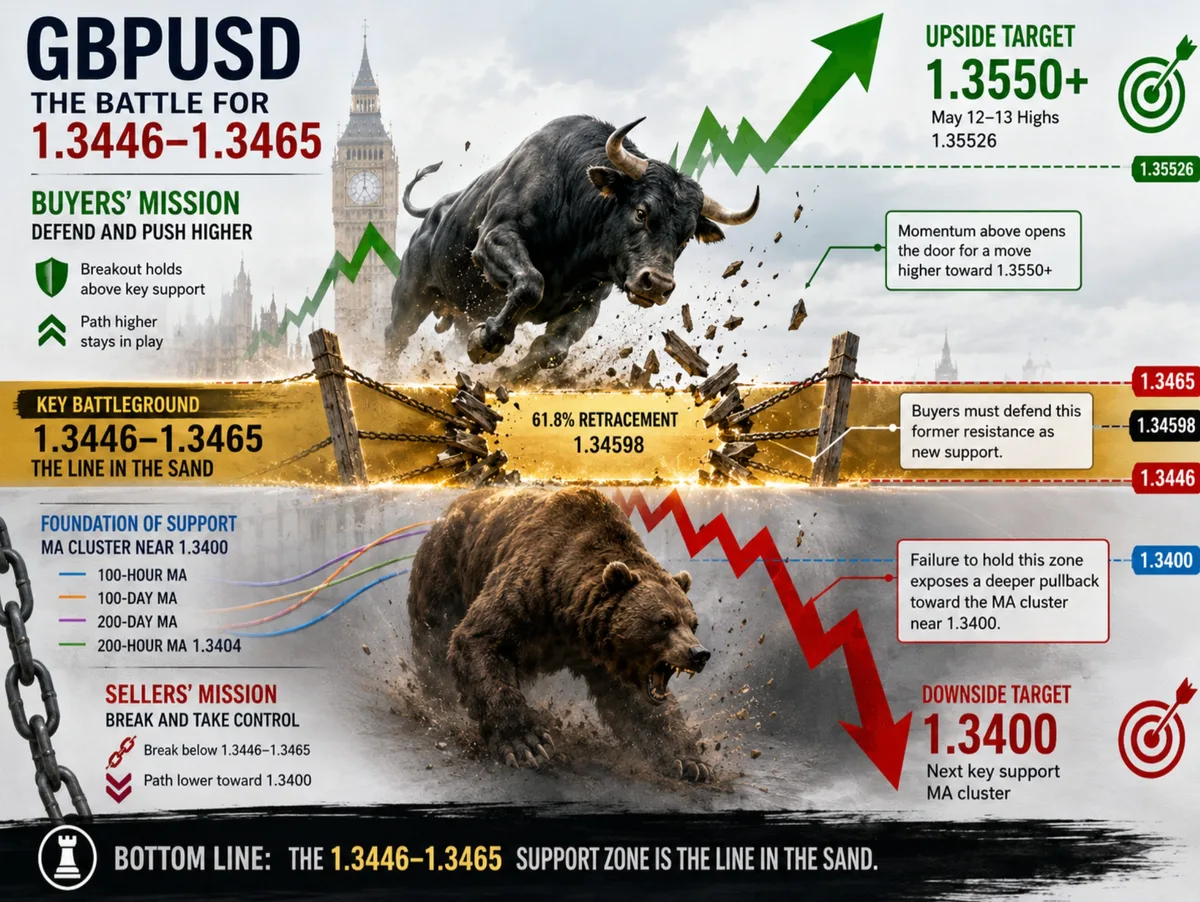
The British pound gave back ground against the dollar Thursday, pulling GBP/USD back to the 1.3446–1.3465 zone — the exact resistance cluster the pair broke above during Wednesday's sharp rally — forcing traders to determine whether the upside move has lasting momentum or was a one-day technical squeeze.
Wednesday's surge was technically significant on multiple fronts. The pair found a floor at the rising 200-hour moving average near 1.3404, then punched through a dense cluster of longer-term averages — the 100-hour, 100-day, and 200-day — before clearing a downward-sloping trend line connecting recent highs. The decisive break above the 1.3446–1.3465 swing area, which also contained the 61.8% Fibonacci retracement of the May 1 decline at 1.34598, accelerated buying momentum and drove the pair as high as 1.3557, briefly topping the May 12–13 swing highs near 1.35526.
Read more BoC Rate Decision, US PPI Data Headline Busy Trading Day →
Thursday's session has flipped that script. GBP/USD rotated lower and spent the past hour retesting the former resistance band, with intraday lows touching 1.3460 before attracting modest buying interest. The 61.8% retracement level is simultaneously being retested, making the zone doubly important from a technical standpoint.
The outcome of this test carries significant implications. If buyers defend the 1.3446–1.3465 area and convert it into support, Wednesday's breakout remains valid and higher targets stay in view. A failure to hold, however, would signal that the prior day's rally was fueled by political headlines, short-covering, and momentum rather than a genuine trend shift — opening the door for a pullback toward the 1.3400 moving-average cluster.
Continue reading at Forexlive.